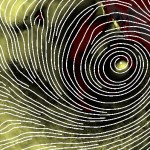
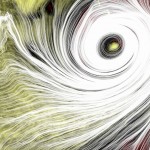
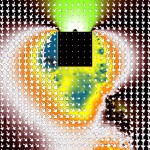
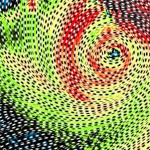
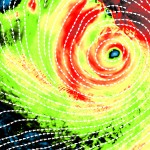
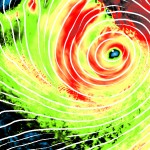
For the laboratory ‘Visualization’ 2007/2008 Matthias Thöny and I developed a flow visualization software.
It enables us to visualise flow data.
Features:
- streamlines (including evenly spaced seedpoints)
- color-coding
- tapering
- texture generation
- glyph mapping
- Flow Visualization
More infos and download (in german only): FlowVis

